anyLogistix 3.3 – Data bundling, KPI metrics and advanced visualisation
The latest version of anyLogistix 3.3 introduces powerful features that make it easier to analyse and optimise your supply chain. The updates focus on improved data interactions and flexible visualisation tools that enable even more detailed analysis. Here is an overview of the most important new features:
Overview of functions
- Data bundling in tables: Group and aggregate data within anyLogistix to quickly sort values into categories and subgroups and get instant insights.
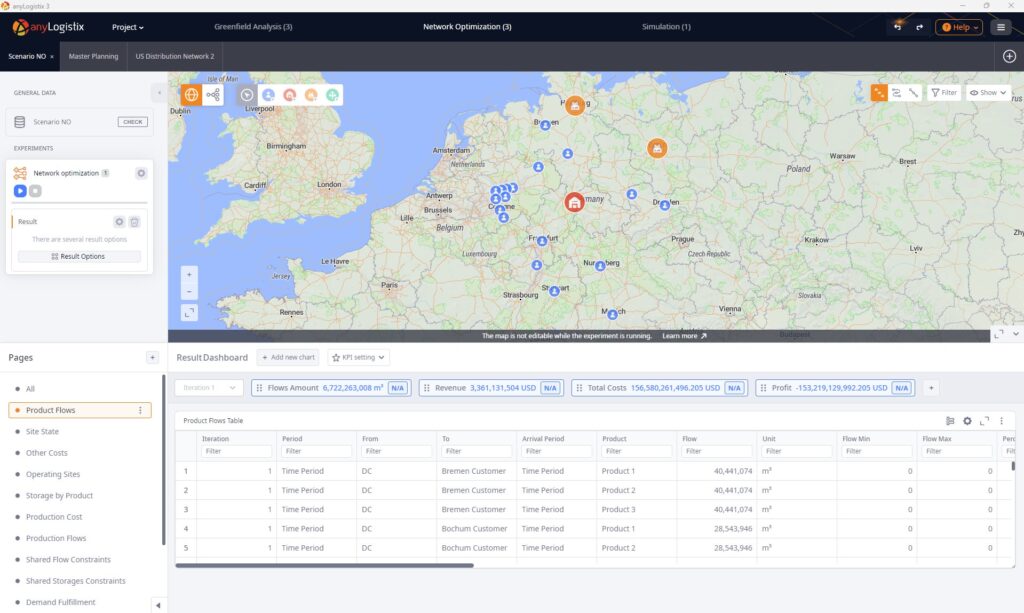
- KPI metrics panel: A customisable metrics panel displays important key figures and allows you to compare them with other runs or scenarios.
- Customisable data display: Select individual data for your analyses and display them in customised diagrams and tables.
- Graphical statistics display: Create linear diagrams, bar charts and histograms for a detailed, visual representation of your results.
- Multi-vehicle support: Multiple vehicle types can be processed simultaneously at loading and unloading gates.
- Other enhancements: API and user interface updates and a new example for time-slot distribution.
Group and analyse data
The new grouping function in the anyLogistix tables allows you to categorise values based on attributes and aggregate numerical data by sum, average, minimum or maximum. This function makes analysis clearer and faster.
Customisable KPI display
The new metrics panel provides a constant view of important performance indicators. You can select statistics from different experiments and display them side by side for detailed comparisons.
Custom data display and charting
anyLogistix 3.3 allows you to select specific values from experiments and display them individually. The results can be displayed in charts such as line, bar or histogram charts, providing a more in-depth analysis.
Multi-vehicle support
The loading and unloading gates now support multiple vehicle types. This increases flexibility and efficiency in the simulation.
Further optimisations
User-friendliness has been improved through a revised design of the tables, API extensions and optimised geocoding. There are also new icons and an example of distribution with time slots.
Discover the new features of anyLogistix 3.3 today and optimise your decision-making processes with more efficient data analysis directly on the platform!


